The last couple of weeks have been chaotic in the stock market. Thursday produced a 10% decline in major U.S. indexes, the 5th worst single day drop in history. Friday saw the market gain 9.3%. On Thursday, VIX closed above 75, the highest close in its history. The maximum closing value of VIX in 2008 was 60. The S&P500 has dropped 20.6% since February 19th. The NASDAQ 100 is down 18.9% and the EAFE is down 23.3% over the same period.
These drops have to be considered in light of previous gains. The S&P500 is down 16.3% for the year to date (YTD) but 2019 delivered a 31% gain. The trailing 12-month return for the S&P500 is -2.5%. For the NASDAQ, 2019 gains were an even more impressive +39%. The YTD return for the NASDAQ 100 is -9.5% and the trailing 12-month return is +9.55%.
The COVID-19 virus is, of course, the trigger for the recent declines, but the severity is compounded by high valuations resulting from the longest bull market in history. It was time for some sort of correction. COVID-19 is going to have a substantial impact on the world economy, although the story is still being written. The decline from the most recent peak in the S&P 500 is about -27%. The bear market of 2007-2008, which officially started in October 2007, resulted in a peak-to-trough drop of -57%. The bear market in year 2000 had a peak-to-trough drop of -49%. In the context of the two most recent bear markets, we may have considerably further to fall before things stabilize.
Another reason to think that this bear market has the potential to get considerably worse is that stock valuations are still quite high. The Shiller P/E ratio (aka PE10) for the S&P500 remains above 25. At the end of the 2007-2008 bear market, the PE10 was at 15. In late 2008, the P/E for Microsoft (MSFT) was around 8. Today, the P/E for MSFT is about 28. At the end of 2008, Apple’s (AAPL) P/E was 12.2. Today, its 22.
Bull or bear markets develop their own momentum. During bull markets, more money is drawn in as investors on the sidelines fear that they are missing out on gains. During bear markets, investors start to lose faith in the value of their holdings and worry as they see how fast the value of stocks can fall. Both of these effects have a self-perpetuating quality. Up until very recently, there were robust trends that suggested that prices would keep going up, although the trends were definitely weakening. By late February, the rapid international spread of COVID-19 triggered a sudden realization of the seriousness of the problem and markets have fallen rapidly and dramatically. Given all of the legitimate concern about COVID-19 and that market valuations are not yet pricing in a substantial reduction in earnings growth, overall market levels are likely to fall further.
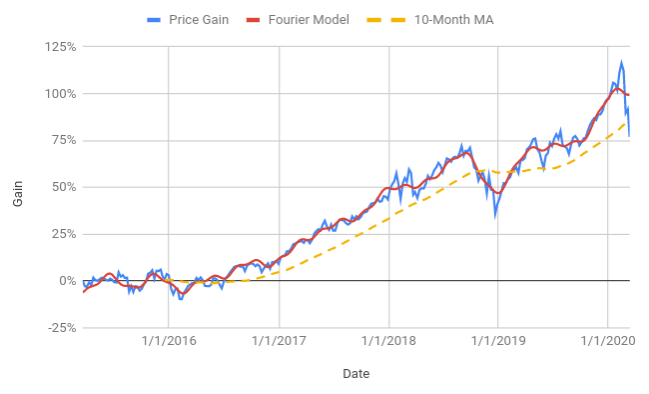
One of the tools that I employ in following markets is Fourier analysis, using a method I have discussed in a range of recent posts. The basic idea is to separate longer-timescale trends and changes in trends from short-term noise. The charts below show this analysis for the S&P500 (SPY) and the NASDAQ 100 (QQQ) through March 13. Two things are evident when contrasted with a similar analysis in mid-February. First, the Fourier trend is now sloping down rather than up. Second, the current prices on these two indexes are well below that trend. This suggests that the markets will continue to be volatile (indicated by how far current prices are below the Fourier model), but are also trending lower overall.