Unemployment is one of the most cited statistics in gauging the health of the economy. Low unemployment numbers are used to suggest that the economy is thriving. Today, the official unemployment rate is 3.5%. Conclusions drawn from unemployment rate, without considering other statistics, may be highly misleading.
There are two key statistics that need to be considered alongside unemployment rate. The first is the labor participation rate, the percentage of adults (those who are aged 16 and older) who are either working or seeking work. The official unemployment statistic counts working-age people who are actively seeking work. Adults who have dropped out of the labor force, retired, or who are in school are not counted. The second key statistic is pay.
Labor participation rate
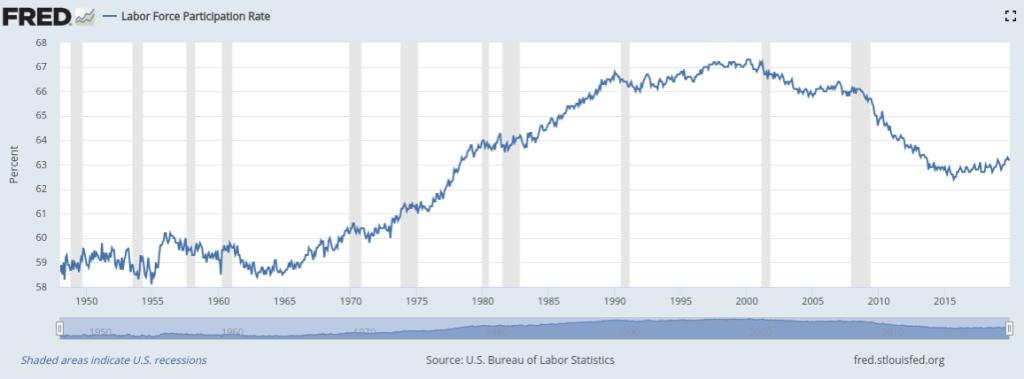
The official labor participation rate for the U.S., from 1950 to today (above), tells a remarkable story. From the 1960’s until about 1990, this measure climbed rapidly as women increasingly entered the workforce and hit a maximum of 67.2% in 2001. Since 2001, the participation rate has fallen. There was an especially steep drop following the recession in 2008 (shaded) and, notably, the participation rate has remained at right around 63% even as the economy has recovered. We are at the same participation rate as in the late 1970’s, early in the large-scale expansion of women in the workforce. There are several drivers of declining labor participation. The crucial takeaway is that 4% fewer Americans ages 16+ are in the workforce today than in 2001.
We get additional insight by looking at the labor participation rate for just ‘prime age’ adults (ages 25 to 54).
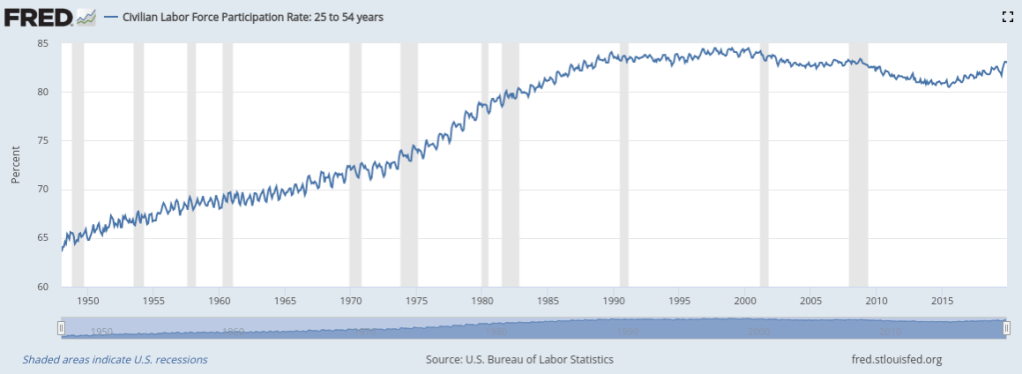
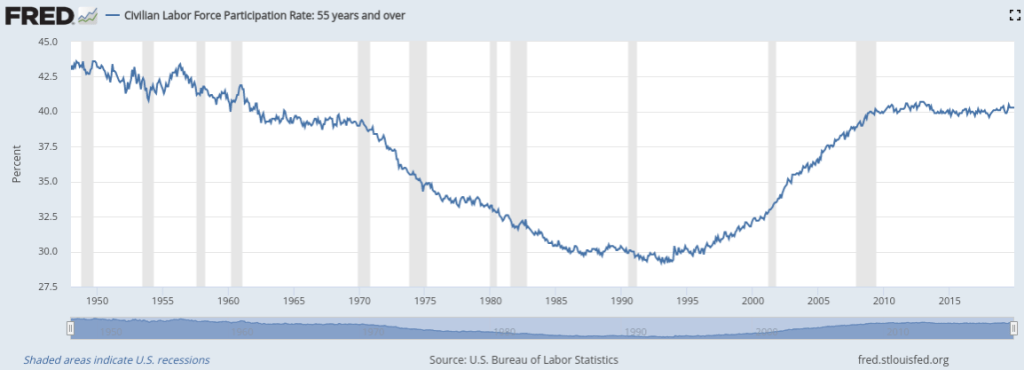
For Americans between 25 and 54, the labor participation rate is 83.1%, just slightly below its 2008 peak of 83.3%, and the absolute maximum, 84.5%, occurred in the late 1990’s. When we look at Americans aged 55 and older, we see that their labor participation rate is almost exactly where it was in the early 1960’s, but with a big decline from 1970 to 1990, and a rise thereafter. Since 2008, this rate has been steady.
One notable aspect of labor participation is that a declining percentage of men are working. In 1970, 80% of men were working while only 69% are working today.
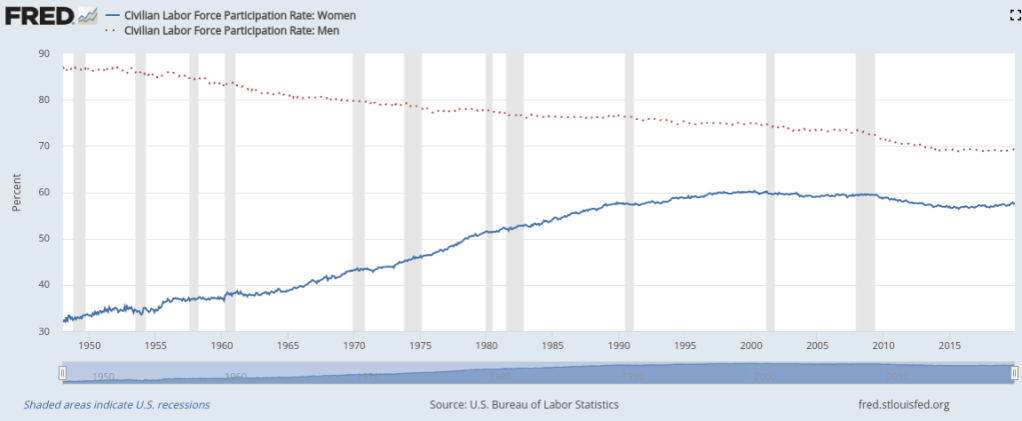
Much of the decline in the labor participation rate in recent years is simply due to Baby Boomers retiring. For the past fifty years, though, there has been downward trend in the percentage of American men who are in the workforce.
What all of these charts on the labor participation rate demonstrate is that the low unemployment may be largely a result of an increasing fraction of adult Americans exiting the workforce. If a smaller proportion of people are working or looking for work, the low unemployment rate tells us considerably less about the overall health of the economy.
Wages
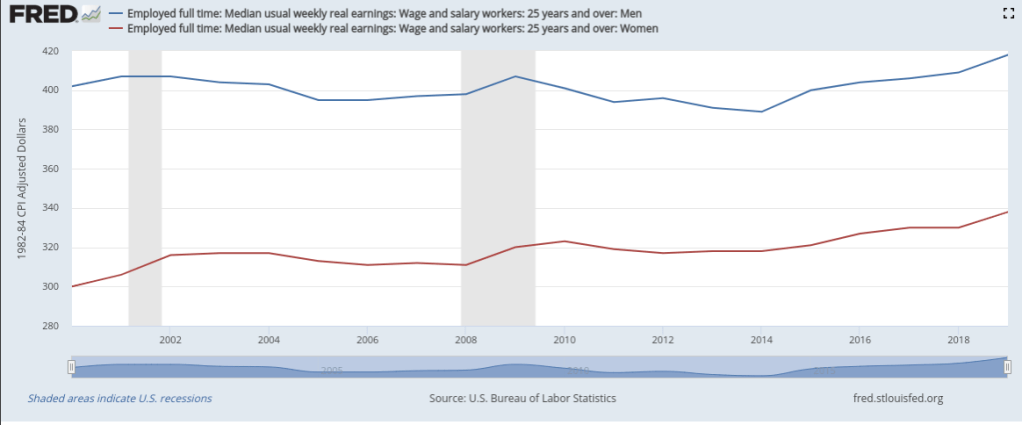
In addition to the percentage of people who are working, the wages for working people are crucial in understanding the health of the economy as a whole. There are two major features of trends in wages. First, average wages for American workers have increased slightly over the last twenty years, after adjusting for inflation. Second, income gains have accrued to the highest-paid workers while the lower-paid have seen no change.
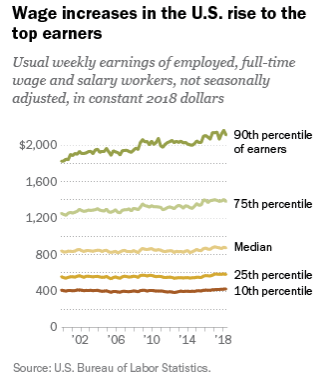
As I have noted elsewhere, there is no reason to assume that inflation-adjusted wages in a wealthy industrialized nation should increase over time. The United States has very high income compared to most of the world. With globalization, it is no small achievement to maintain real wages for the lowest-paid workers. That said, if employers were competing for a tight supply of workers, one would expect to see real wages rising faster. In 2019, median real wages went up faster than in recent years. A continuation of this trend would be a good sign for workers.
Conclusions
It is certainly notable that the official unemployment rate is 3.5%. Considering that a substantially smaller percentage of American adults are in the workforce today (63% labor participation today vs. 67% in 2000), the unemployment figure is a lot less impressive. Furthermore, median income for full-time workers has barely increased over the past decade, suggesting that employers are not offering high enough wages to draw idled workers back to the workforce. Taken together, these metrics suggest that there is little or no unmet demand for median- and lower-paid workers. People at the high end of the income scale are seeing meaningful real income growth, reflecting a robust job market for those with professional skills. The median worker is likely to take little comfort in annual gains of $3 in weekly (inflation-adjusted) wages, however, because the costs of housing, healthcare, end education have risen much faster than inflation for decades.
