In discussions of all sorts of public policy, it is common to see references to the average American or the average household. It seems to me that the entire idea of the average American household may be fairly meaningless.
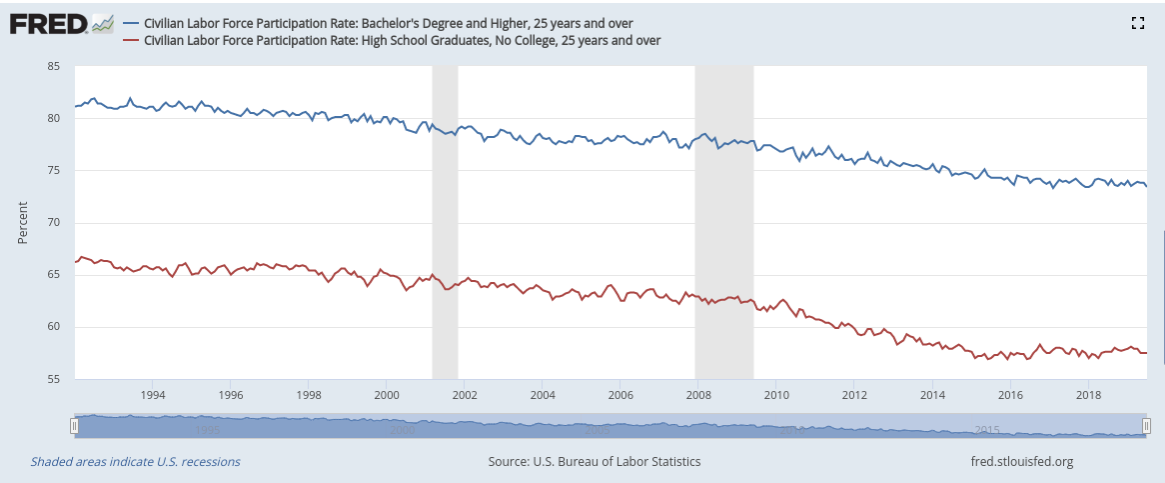
About 33% of Americans have a college education. The average incomes of people with college degrees are much higher than for people without a college degree. The percentage of college grads working is vastly higher than non-grads. The Labor Force Participation Rate (the percentage of all Americans who are working) for college grads (aged 25 and older) is 74% vs. 58% for non-grads (see below). The unemployment rates for these two groups are 2.5% and 3.6%, respectively.

Does it make sense to average college grads and non-grads together for any purpose? And education is only one axis of difference.
In an increasingly stratified society, the idea of an average American or household doesn’t tell us much of anything. The Economic Policy Institute recently published its report titled The State of American Retirement Savings. The results support widespread concern that American households are not saving nearly enough, but what is most striking is the enormous disparities between different groups.
Here are some of the results from analysis of U.S. households for which the head of the household is between 32 and 61. References to the age of a household refers to the person who is head of household. In this analysis, retirement savings refer to 401(k), Individual Retirement Accounts, and related retirement savings accounts. This will not include other savings or investments. Consider the following findings:
- Only 19% of households will receive a traditional pension
- Only 58% of households have any retirement savings plan at all
- The median retirement savings for a household aged 56-61 is $21,000
- The average retirement savings for a household aged 56-61 is $244,000
- The median retirement savings for all households, aged 32-61, is $7,800
- The top 20% of retirement savings for all households, aged 32-61, is $125,000
- The top 10% of retirement savings for all households, aged 32-61, is $320,000
Seeing that the average is vastly different from the median tells us a lot about inequality. The median is the amount such that 50% of households have less and 50% have more. The average is very different from the median when a small number of people have much more than the median.
How much can the top 10% have in common with the median when the top 10% has forty times the retirement savings as the median household?
The types of statistics shown here–and there are many more cases–suggest that the notion of the middle class may need to be reconsidered. We have a national narrative of a large population of households who enjoy good public schools, live in safe neighborhoods, and who can afford comfortable homes and to provide economic opportunity for their children. In reality, is this a norm or are these benefits only available to a top economic tier such as the wealthiest 25% or so?
