One of the largest factors in being successful with money is the ability to manage debt. In modern America, we have become accustomed to taking on ever-higher levels of debt. This substantial growth in household debt is a major issue for both individuals and society as a whole.
The growing burden of debt
The key measure of household indebtedness is the debt-to-income ratio. This is the ratio of a household’s total debts to its total income. Banks and other lenders refer to the ratio of monthly debt payments to monthly income as debt-to-income but we are looking at the economist’s version (total debt to total income). Both measures are often referred to as DTI.
In 1980, the average debt-to-income ratio for American households was 0.63. That ratio rose to about 0.75 in 1990 and then 0.85 in 2000. Debt-to-income passed 1.0 in 2003 and reached a peak of 1.24 in mid 2007, shortly before the housing bubble popped and we entered the great recession and market crash pf 2008. While debt-to-income has declined substantially since the mid-2000’s, the ratio currently stands at about 0.96.
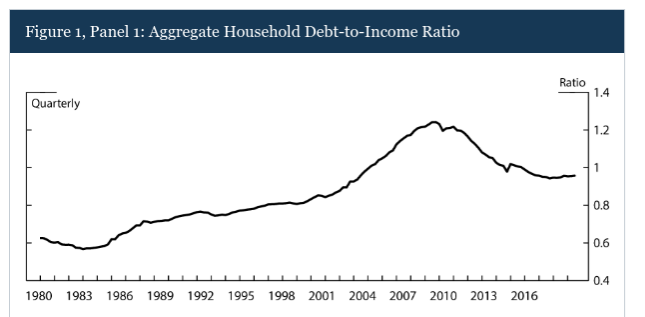
For a homeowner with a mortgage, a DTI ratio of 1 is actually very low. The average DTI is calculated across all households, however, whether or not they have mortgages or any debt at all. The rise in DTI shown in this chart illustrates that Americans carry substantially more debt than they used to.
The trend in DTI mirrors total debt (below). The peak in DTI in the late 2000’s corresponds to the peak in total mortgage debt. Since then, total mortgage debt has declined. Education debt has grown substantially over the past couple of decades though, and is now the largest form of debt other than mortgages.

The debt life cycle
Not surprisingly, there is enormous variability in debt-to-income by region. In addition, debt-to-income tends to evolve through one’s life. Younger people often need to borrow for their educations and start their careers at the low end of the range for their professions. The chart below shows average levels of debt across all American households by age (including those with no debt).

Source: Money.com
After college, the next big class of borrowing tends to be for homes. The average debt load for mortgages and home equity lines of credit (HELOCs) increases rapidly from age 35 to 44 and then flattens for people between 45 and 54.It is notable that average mortgage and other real estate debt is still substantial for people between 65 and 74.

Looking at the ages of people who carry debt, it is striking that people aged 60 and above now carry a much higher fraction of household debt than they used to (see chart above). In 2003, 12.5% of household debt was held by the 60+ cohort. Today, that fraction is 22.8%. Not only are people taking on far more debt than they used to. They are also carrying that debt until later ages. This is, of course, consistent with higher DTI over time. Higher DTI necessitates longer payoff periods.
The American way of debt
The charts in this post show that American households are taking on more debt relative to their income and have higher absolute level of debt than previous generations. While it is a good sign that DTI is lower than it was in the mid 2000’s, during the housing bubble, the DTI is still substantially higher than it was during the 1980’s and 1990’s.
Not surprisingly, one of the major determinants of a household’s financial fragility is the amount of debt that it carries. Higher debt means that a household is less able to respond to a loss of income or unexpected expenses. Debt repayment also limits a household’s ability to save for other things–like retirement or college. Current debt levels are a major concern for American households. Simply put, we are funding too much of our consumption by borrowing and the long-term implications are ugly.
