As of March 13th, the S&P 500 is around 10% below its recent high and the NASDAQ index is about 13% below its high. Market volatility has risen dramatically, too. The broad decline and higher volatility are, of course, driven by concerns about how President Trump’s tariffs will impact both the domestic and international economies. There is a tangible sense of fear among investors. I have no insight into the future of tariffs, but there are some useful lessons that I am reminded of in terms of how individuals and families can understand the current environment.
Recent Years’ Returns Are Unusually High
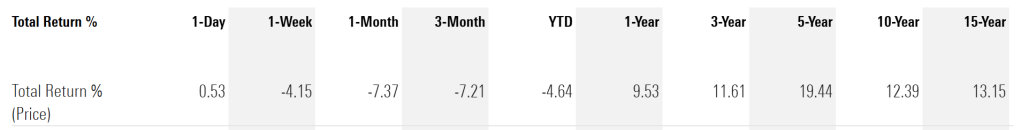
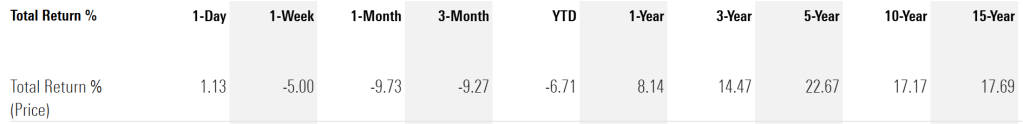
To begin, it is useful to put the recent market declines into context. When the markets have been hitting all-time highs, it is important to remember that markets also decline. To provide context, consider the trailing total returns on the S&P 500 (using the ETF SPY) and the NASDAQ 100 (QQQ). While these indexes are down for the year-to-date (YTD), the trailing returns over longer periods are quite high. The trailing 10-year annualized return for SPY is 12.39% per year. Over the same period, QQQ has annualized return of 17.17% per year. Compared to longer-term historical returns, these are high numbers.
For comparison, the annualized total returns for the S&P 500 over much longer periods are lower than those over recent years:
| Years Through 2024 | Annualized Total Return |
| 97 | 9.94% |
| 50 | 12.26% |
| 40 | 11.68% |
| 30 | 10.82% |
| 20 | 10.26% |
| 10 | 12.98% |
The data in this table are maintained and updated at NYU Stern, going back to 1928. The 97-year period is for 1928 through 2024. Note that the 10-year annualized return in the table above is lower than the value for SPY from Morningstar. This difference is due to the fact that the Morningstar value is for return through March 12, 2025 and the value in the table above is to the end of 2024.
The long-term historical returns show that recent years have been unusually good to investors. After a long-period of strong returns, there is typically some reversion to the mean, whereby the factors that drove growth, optimism, and momentum peter out. The gains in recent years have been unsustainably high, resulting in high valuations for stocks. The good news cannot continue unabated. Even without the chaos and distress caused by tariffs and the ongoing uncertainties, something would have served as the catalyst for a decline.
Understanding Volatility
While it feels to many investors as though the markets have been swinging wildly, recent volatility is not especially high. The most-followed measure of volatility is the VIX, currently running at about 25. The VIX represents the standard deviation in returns implied by near-term options (think options that expire in the next 30 days) on the S&P 500. A VIX of 25 corresponds to expected annualized volatility of 25%. The trailing 10-year annualized volatility (standard deviation) of the return from the S&P 500 is 15.2%, so current conditions are considerably more volatile than the market has been (on average) over the past decade.
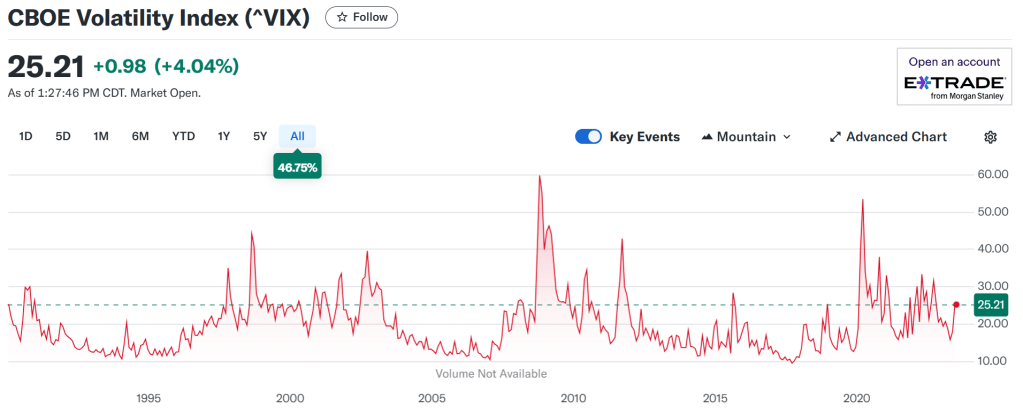
Looking at VIX over several decades, the current value, while well above the average, is not especially high as compared to other periods of market stress. During the COVID-driven market swoon and the 2008 financial crisis, VIX went above 50, for example.
One of the ways to put recent volatility in context is to look at long-dated options on the S&P 500. I do a lot of options analysis, so this is a type of calculation that I do all the time. Based on my calculations, the expected volatility implied by options that expire in January 2026 is about 20%. ETrade calculates the volatility implied by these options to be 21%. These values mean that the longer-term options on the S&P 500 indicate that volatility will tend to decline as the year progresses.
Implications
The recent, and ongoing, declines in equity markets were inevitable, even if the specific trigger was unknown. The market chaos fomented by a constantly changing U.S. tariff policy is certainly unsettling, but the market declines are in no way exceptional, especially after such a long period of high returns. We may not be able to predict the trigger for a market decline, but it is essentially guaranteed that markets will drop after an extended period of gains. People who are suffering severe discomfort due to recent market declines may want to consider whether they are holding portfolios at an appropriate risk level, especially since current volatility is not especially high as compared to other periods of market stress. Investors must be cognizant of the tradeoff of risk vs. the potential for gains. Understanding current market behavior in the context of history is quite helpful in evaluating one’s goals and risk tolerance. I have no prediction as to how low the markets will go, but I am not unduly rattled by the market drop so far in 2025. Markets decline and the only way to reap the benefits of equities is to bear the risk of falling share prices.
